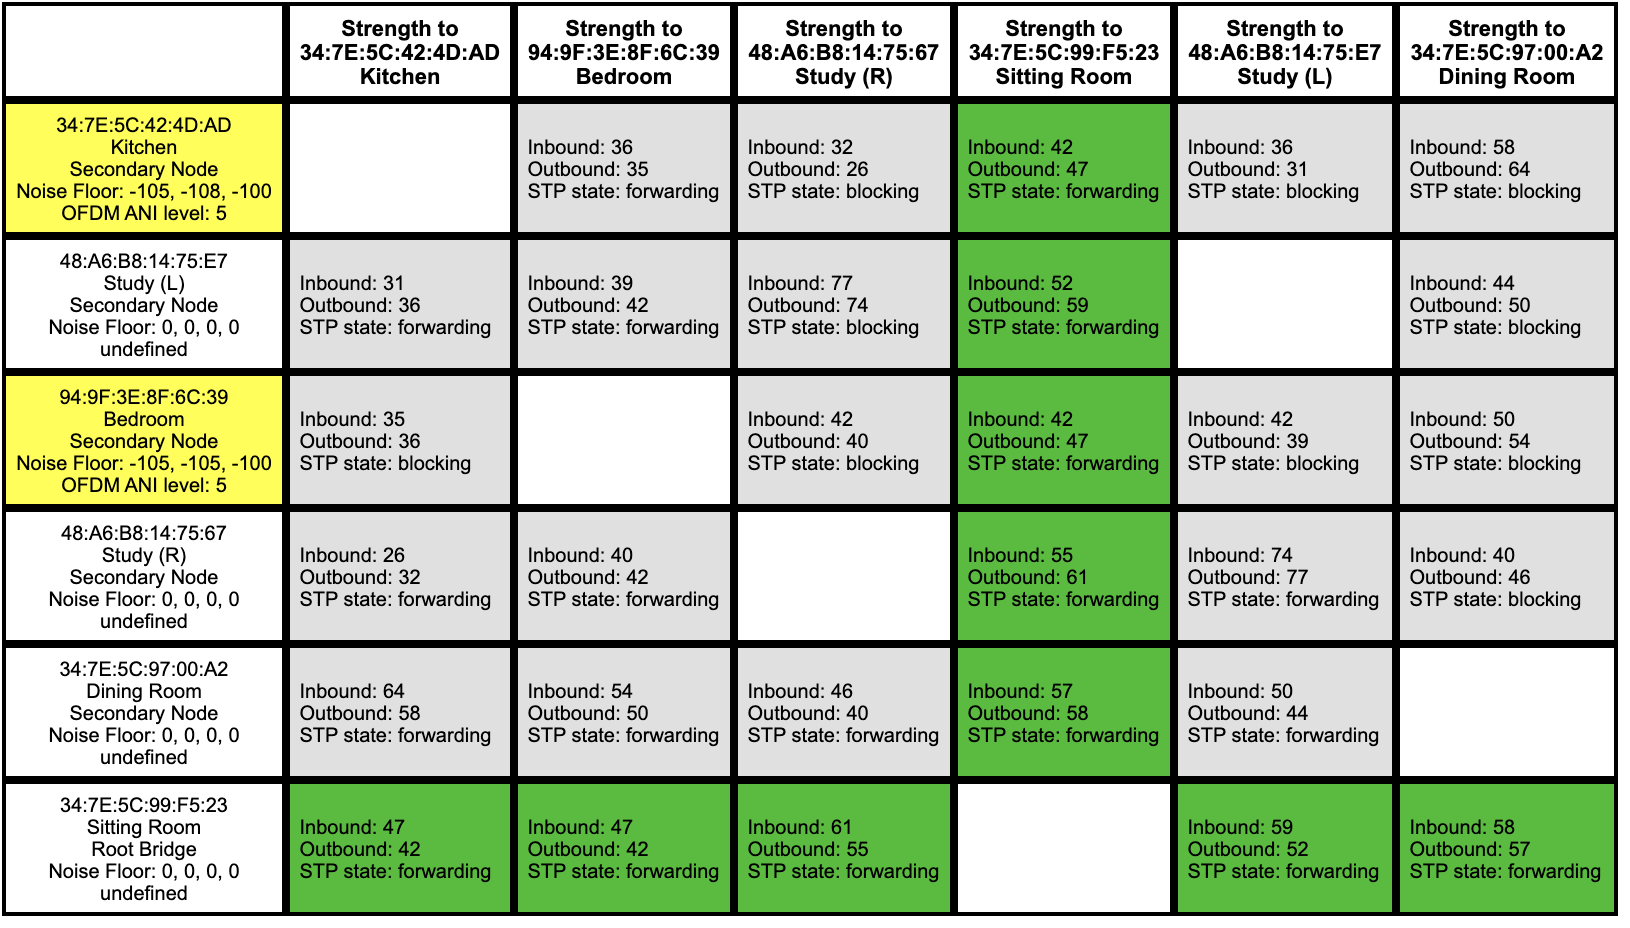
I’m quite a fan of Sonos audio equipment but recently had some trouble with some of the devices glitching and even cutting out whilst playing. Under the covers Sonos stuff is running Linux (of course) and exposes some diagnostics through a rudimentary frontend that you can access at http://<sonos player IP>:1400/support/review:

Whilst this gives you the current state, you can’t get historical data on it. It felt like the problems were happening "all the time", but were they actually? For that, we need some cold, hard, data! Something like this, in fact:
+---------------------+---------+----------+---------------+
|WINDOW_START_TS      |DEVICE   |STATUS    |STATUS_COUNT   |
+---------------------+---------+----------+---------------+
|2020-01-21 00:00:00  |Kitchen  |YELLOW    |183            |
|2020-01-21 00:00:00  |Kitchen  |RED       |162            |
|2020-01-21 00:00:00  |Kitchen  |ORANGE    |156            |
|2020-01-21 00:00:00  |Kitchen  |GREEN     |5              |
[…]
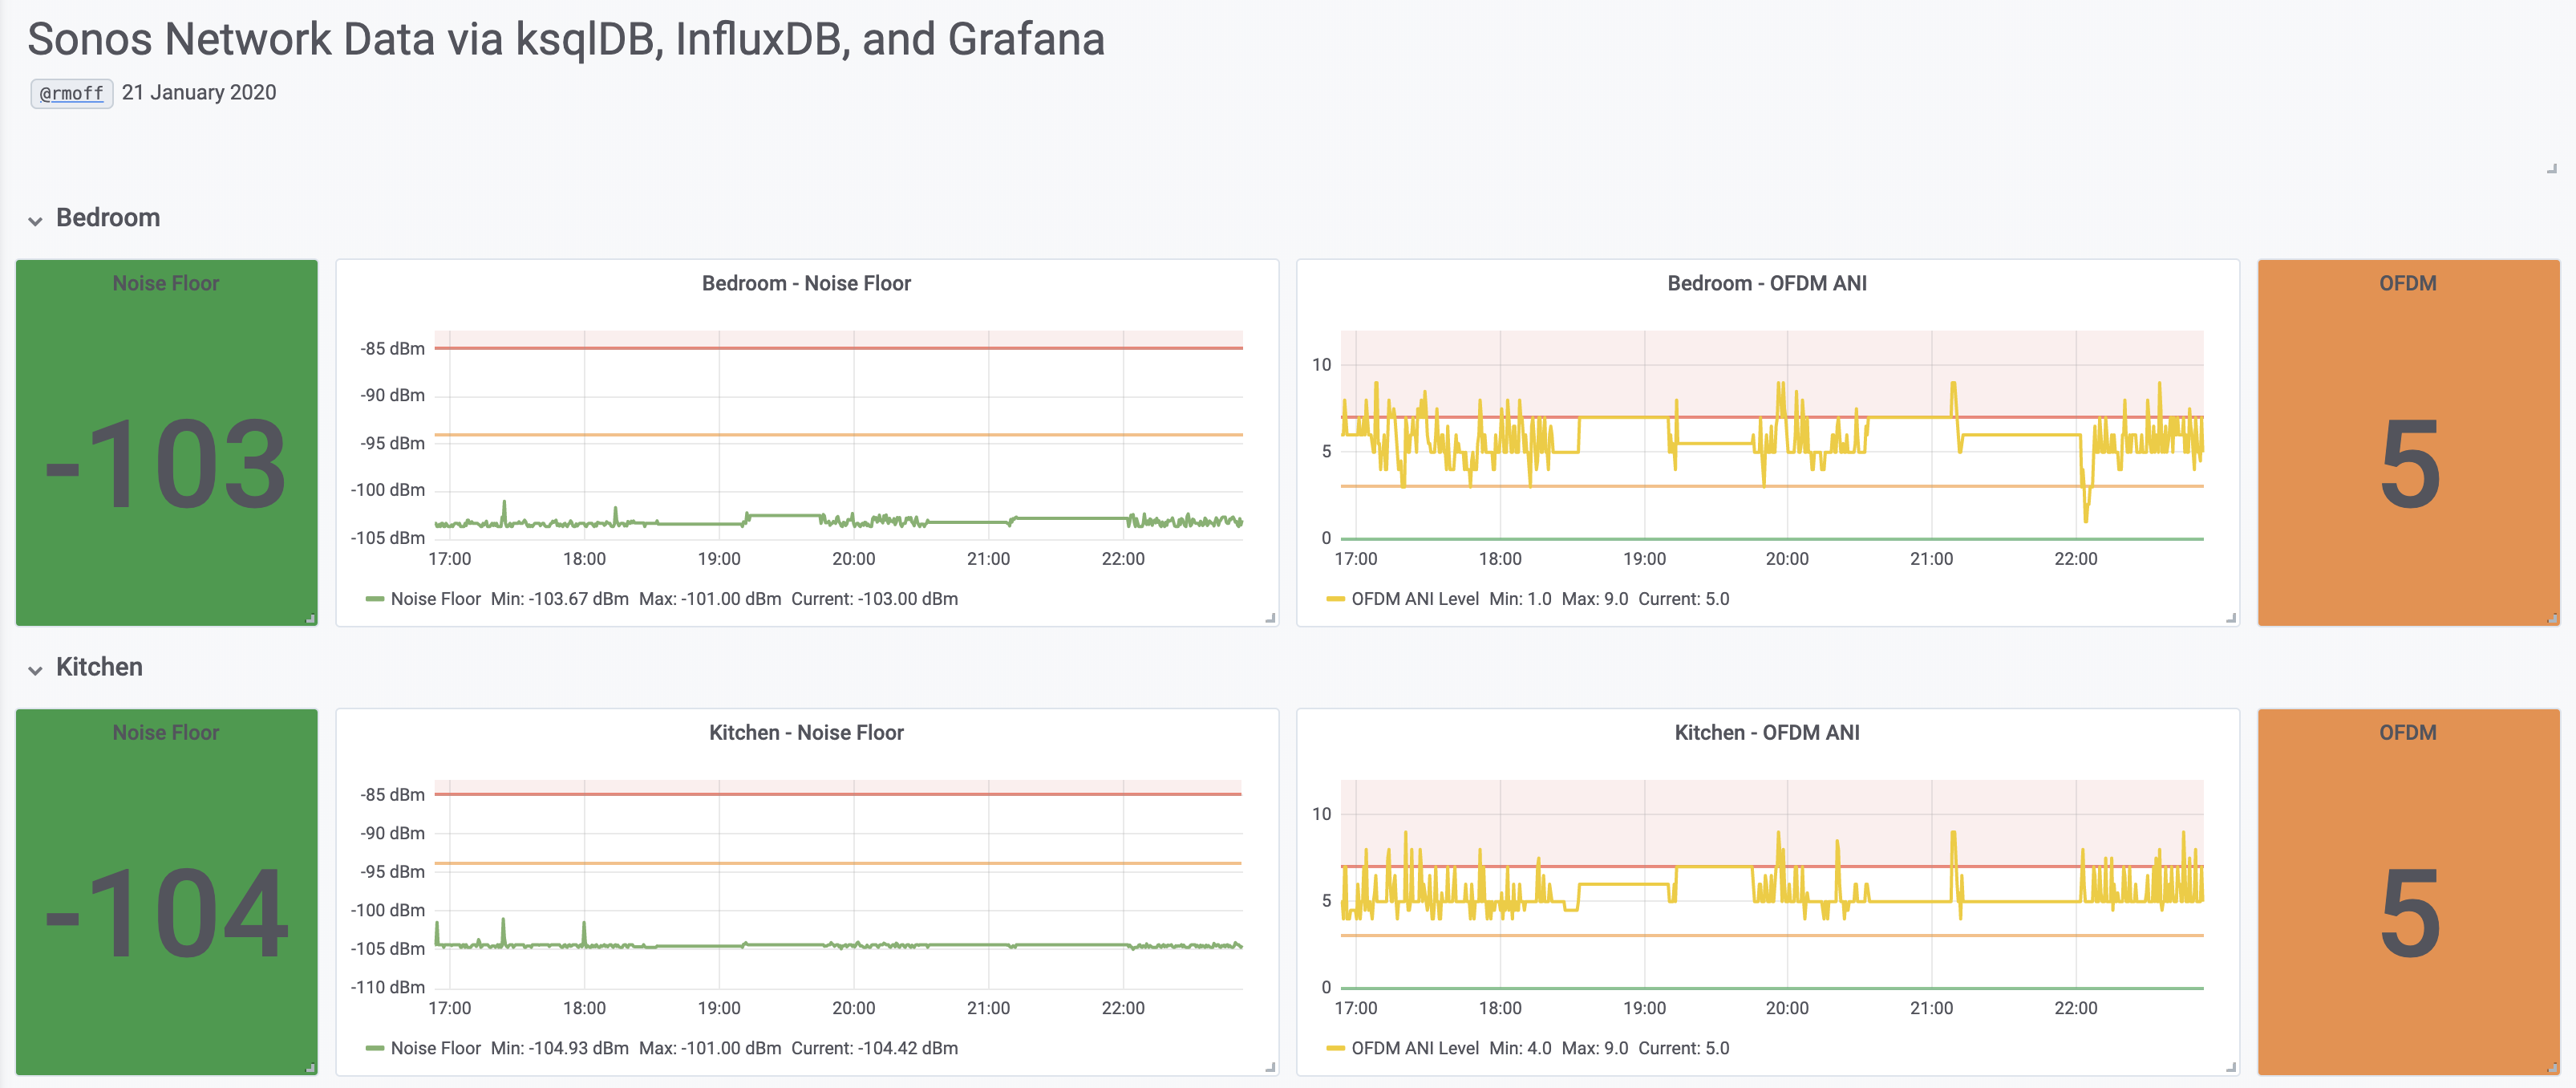
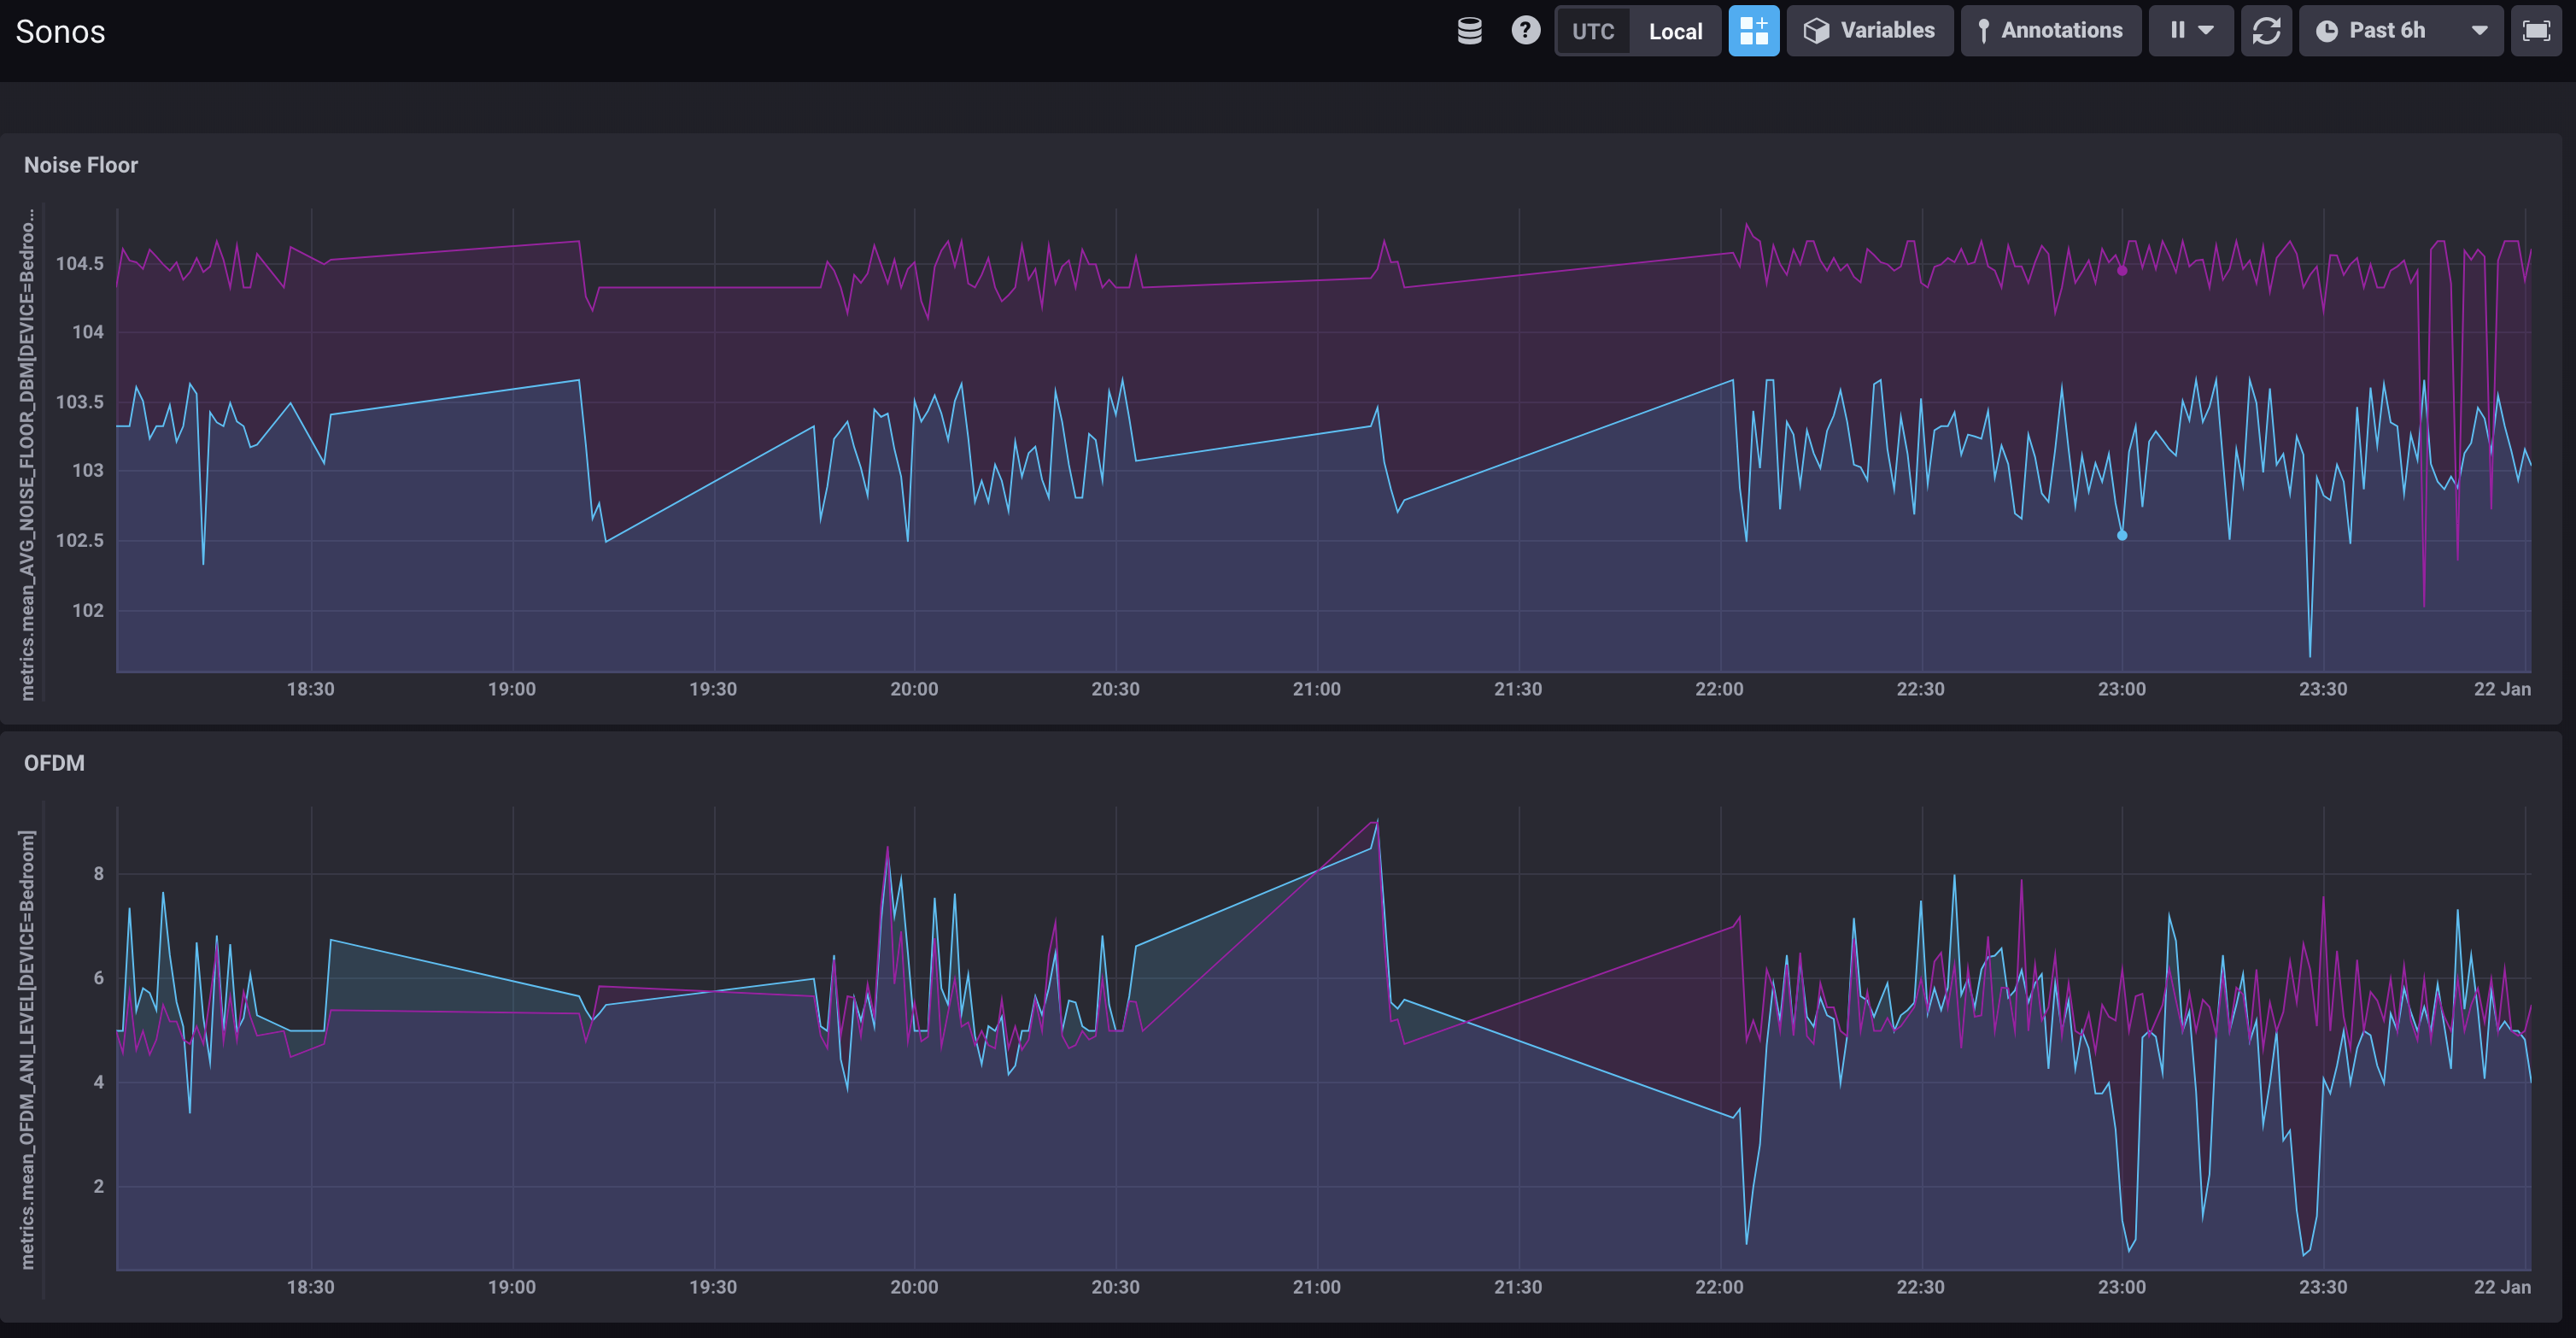
Summaries are nice, but so’s a plot of the data over time:

In this article I’ll walk through how to collect this data and process it using some of my favourite tools including ksqlDB, InfluxDB, and Grafana.
Which data are we going to collect? For now it’s based on two metrics of interest here - Noise Floor and OFDM ANI level. Why these two? Well, if we open up the code behind the Network Matrix shown above, we can see the Javascript that defines the colour of the cells evaluates these two:
[…]
if( nf > 94 && ofdm > 4 )
    td.style.background = "rgb(32,190,32)"; // GREEN
else if( nf > 89 && ofdm > 3 )
    td.style.background = "rgb(255,255,32)"; // YELLOW
else if( nf > 84 && ofdm > 2 )
    td.style.background = "rgb(255,159,32)"; // ORANGE
else
    td.style.background = "rgb(255,32,32)"; // RED
[…]
The stack 🔗
-
curlto poll the API for diagnostics, and parse it withxq -
kafkacat to stream the data into Kafka
-
Apache Kafka to stream and store the data
-
ksqlDB to process, wrangle, and query the data
-
Kafka Connect to load the data into InfluxDB
-
Grafana to visualise it all
Why Kafka? Because we’re doing all of this with streams of events. We want to have a low-latency pipeline from event to dashboard, and we also want to be able to replay and re-use the data.
Ingest diagnostics data from Sonos into Kafka 🔗
We’re going to go full-MacGyver for part of this, since Sonos does not offer a nice API. The diagnostics that Sonos devices serve up on the http://<sonos player IP>:1400/support/review interface (I’ll not actually call it an API, since it isn’t really) are XML-wrapped plaintext. So whilst XML may actually be nicer than YAML to work with (who knew), plain text is not so nice to work with. Fancy parsing this for key/value pairs? It’s going to be all hand-crafted code needed:
Mode: INFRA (sonosnet)
Operating on channel 2437
Home channel is 2437
HT Channel is 0
RF Chains: RX:4 TX:4
RF Chainmask: RX:0x0F TX:0x0F
Max Spatial Streams: RX:4 TX:4
Noise Floor:    0 dBm (chain 0 ctl)
Noise Floor:    0 dBm (chain 1 ctl)
Noise Floor:    0 dBm (chain 2 ctl)
Noise Floor:    0 dBm (chain 3 ctl)
PHY errors since last reading/reset: 3882
To pull the data from Sonos you just need to hit one of the devices, since it serves up the stats for all the others too. I’m using xq here which is an XML version of the superb jq tool (which is for JSON). It means that I can stream data from curl into xq and parse the document structure for fields and values that I want, as well as starting to manipulate the data into more of a structure for processing (such as splitting the status data shown above into an array).
Once it’s parsed the data it pipes it into kafkacat which writes it to a Kafka topic, as well as echo’ing it to the terminal.
while [ 1 -eq 1 ];do
    curl -s 'http://192.168.10.98:1400/support/review' | \
        xq -c '.ZPNetworkInfo.ZPSupportInfo[] |
            {ZPInfo: .ZPInfo.ZoneName,
            data: [(.File[] |
                    select (."@name" == "/proc/ath_rincon/status") |
                    ."#text" |
                    split("\n")[] |
                    select((. | contains("OFDM")) or (.|contains("Noise")) or (.|contains("PHY"))))]
                }' | \
            docker exec -i kafkacat kafkacat \
                -b kafka-1:39092,kafka-2:49092,kafka-3:59092 \
                -t sonos-metrics -P -T | jq '.'
    sleep 20
done
Query the streams of data in ksqlDB 🔗
Now the data’s in Kafka we can examine and process it with ksqlDB. First up we need to create a stream on top of the topic—which is just declaring the schema for the data:
CREATE STREAM SONOS_RAW (ZPINFO STRING, DATA ARRAY<VARCHAR>,RAWDATA STRING)
    WITH (KAFKA_TOPIC='sonos-metrics', VALUE_FORMAT='JSON');
We can query this data:
ksql> SET 'auto.offset.reset' = 'earliest';

ksql> SELECT TIMESTAMPTOSTRING(ROWTIME,'yyyy-MM-dd HH:mm:ss','Europe/London') AS TS,
             ZPINFO,
             DATA
        FROM SONOS_RAW
        EMIT CHANGES
        LIMIT 1;
+---------------------+-------------+-----------------------------------------------------------+
|TS                   |ZPINFO       |DATA                                                       |
+---------------------+-------------+-----------------------------------------------------------+
|2020-01-13 23:02:09  |Study (R)    |[Noise Floor:    0 dBm (chain 0 ctl), Noise Floor:    0 dBm|
|                     |             | (chain 1 ctl), Noise Floor:    0 dBm (chain 2 ctl), Noise |
|                     |             |Floor:    0 dBm (chain 3 ctl), PHY errors since last readin|
|                     |             |g/reset: 6803        ]                                     |
Limit Reached
Query terminated
ksql>
and we can manipulate the data using standard SQL capabilities - for example to take a substring of a value and cast it to a new type:
ksql> SELECT ZPINFO,
             DATA[1],
             CAST(SUBSTRING(DATA[1],14,4) AS DOUBLE) AS NOISE_FLOOR_DBM0
     FROM   SONOS_RAW
     EMIT CHANGES;
+----------------+---------------------------------------------+---------------------------------------------+
|ZPINFO          |KSQL_COL_1                                   |NOISE_FLOOR_DBM0                             |
+----------------+---------------------------------------------+---------------------------------------------+
|Bedroom         |Noise Floor: -104 dBm (chain 0 ctl)          |-104.0                                       |
|Study (L)       |Noise Floor:    0 dBm (chain 0 ctl)          |0.0                                          |
[…]
Transform the data in ksqlDB 🔗
The actual data that we want to pull out for now is just the device name (ZPINFO), Noise Floor, and OFDM ANI level. We’ll do this with some data wrangling along the same lines as shown above.
A key thing to note is that the CREATE STREAM here is now writing the results of this query to a new stream, underpinned by a new Kafka topic:
CREATE STREAM SONOS_HEALTH_METRICS WITH (KAFKA_TOPIC='sonos_metrics_01') AS
    SELECT MAP('DEVICE':=ZPINFO) AS TAGS,
            (( (CAST(SUBSTRING(DATA[1],14,4) AS DOUBLE) + CAST(SUBSTRING(DATA[2],14,4) AS DOUBLE) +  CAST(SUBSTRING(DATA[3],14,4) AS DOUBLE)) /3 )) AS AVG_NOISE_FLOOR_DBM,
            CAST(SUBSTRING(DATA[1],14,4) AS DOUBLE) AS NOISE_FLOOR_DBM0,
            CAST(SUBSTRING(DATA[2],14,4) AS DOUBLE) AS NOISE_FLOOR_DBM1,
            CAST(SUBSTRING(DATA[3],14,4) AS DOUBLE) AS NOISE_FLOOR_DBM2,
            CAST(SUBSTRING(DATA[5],17,2) AS INT) AS OFDM_ANI_LEVEL,
            (12-CAST(SUBSTRING(DATA[5],17,2) AS INT))/2 OFDM_ANI_LEVEL_ADJUSTED
    FROM   SONOS_RAW
    EMIT CHANGES ;
Note the schemas includes a MAP for the tags, which we’ll use to load into InfluxDB shortly.
ksql> DESCRIBE SONOS_HEALTH_METRICS;

Name                 : SONOS_HEALTH_METRICS
 Field                   | Type
--------------------------------------------------------
 ROWTIME                 | BIGINT           (system)
 ROWKEY                  | VARCHAR(STRING)  (system)
 TAGS                    | MAP<STRING, VARCHAR(STRING)>
 AVG_NOISE_FLOOR_DBM     | DOUBLE
 NOISE_FLOOR_DBM0        | DOUBLE
 NOISE_FLOOR_DBM1        | DOUBLE
 NOISE_FLOOR_DBM2        | DOUBLE
 OFDM_ANI_LEVEL          | INTEGER
 OFDM_ANI_LEVEL_ADJUSTED | INTEGER
--------------------------------------------------------
For runtime statistics and query details run: DESCRIBE EXTENDED <Stream,Table>;
From this fairly simple transformation we now have a set of metrics which we can query from the stream:
ksql> SELECT TIMESTAMPTOSTRING(ROWTIME,'yyyy-MM-dd HH:mm:ss','Europe/London') AS TS,
             TAGS['DEVICE'] AS DEVICE,
             AVG_NOISE_FLOOR_DBM,
             OFDM_ANI_LEVEL_ADJUSTED
        FROM SONOS_HEALTH_METRICS
        EMIT CHANGES
        LIMIT 5;
+---------------------+-------------+----------------------+-------------------------+
|TS                   |DEVICE       |AVG_NOISE_FLOOR_DBM   |OFDM_ANI_LEVEL_ADJUSTED  |
+---------------------+-------------+----------------------+-------------------------+
|2020-01-14 06:33:24  |Sitting Room |0.0                   |null                     |
|2020-01-14 06:34:26  |Kitchen      |104.33333333333333    |4                        |
|2020-01-14 06:36:30  |Study (L)    |0.0                   |null                     |
|2020-01-14 06:37:32  |Bedroom      |103.66666666666667    |4                        |
|2020-01-14 06:37:32  |Study (R)    |0.0                   |null                     |
Limit Reached
Query terminated
ksql>
We can also query it from the underlying Kafka topic:
ksql> PRINT sonos_metrics_01 LIMIT 5;
Format:JSON
{"ROWTIME":1578956524472,"ROWKEY":"null","TAGS":{"DEVICE":"Study (R)"},"AVG_NOISE_FLOOR_DBM":0,"NOISE_FLOOR_DBM0":0,"NOISE_FLOOR_DBM1":0,"NOISE_FLOOR_DBM2":0,"OFDM_ANI_LEVEL":null,"OFDM_ANI_LEVEL_ADJUSTED":null}
{"ROWTIME":1578956524472,"ROWKEY":"null","TAGS":{"DEVICE":"Dining Room"},"AVG_NOISE_FLOOR_DBM":0,"NOISE_FLOOR_DBM0":0,"NOISE_FLOOR_DBM1":0,"NOISE_FLOOR_DBM2":0,"OFDM_ANI_LEVEL":null,"OFDM_ANI_LEVEL_ADJUSTED":null}
{"ROWTIME":1578956524472,"ROWKEY":"null","TAGS":{"DEVICE":"Kitchen"},"AVG_NOISE_FLOOR_DBM":104.33333333333333,"NOISE_FLOOR_DBM0":-104,"NOISE_FLOOR_DBM1":-109,"NOISE_FLOOR_DBM2":-1E+2,"OFDM_ANI_LEVEL":5,"OFDM_ANI_LEVEL_ADJUSTED":3}
{"ROWTIME":1578956524472,"ROWKEY":"null","TAGS":{"DEVICE":"Sitting Room"},"AVG_NOISE_FLOOR_DBM":0,"NOISE_FLOOR_DBM0":0,"NOISE_FLOOR_DBM1":0,"NOISE_FLOOR_DBM2":0,"OFDM_ANI_LEVEL":null,"OFDM_ANI_LEVEL_ADJUSTED":null}
{"ROWTIME":1578956603128,"ROWKEY":"null","TAGS":{"DEVICE":"Study (R)"},"AVG_NOISE_FLOOR_DBM":0,"NOISE_FLOOR_DBM0":0,"NOISE_FLOOR_DBM1":0,"NOISE_FLOOR_DBM2":0,"OFDM_ANI_LEVEL":null,"OFDM_ANI_LEVEL_ADJUSTED":null}
Transform the message structure to load into InfluxDB 🔗
In a moment we’re going to stream all this data into InfluxDB, but first we need to do a little random jiggling to get the data into an appropriate format.
|
Warning
|
This is not part of a normal ksqlDB pipeline! It’s just a hacky workaround to deal with some slightly misaligned interfaces. |
In a nutshell, the InfluxDB connector needs the data to either have a schema embedded in the JSON, or the Avro schema to be constructed a certain way (map not array). Here we’ll interpolate the JSON-with-schema shell with the payload value, using kafkacat:
kafkacat reads from the topic, pipes it into jq which adds the schema definition, and then pipes it to another instance of kafkacat which writes it to a new topic.
docker exec -it kafkacat /bin/sh -c 'kafkacat -b kafka-1:39092,kafka-2:49092,kafka-3:59092 -q -u -X auto.offset.reset=latest -G sonos_rmoff_cg_01 sonos_metrics_01 |jq -c '"'"'. |
{   schema: { type: "struct", optional: false, version: 1, fields: [
            { field: "tags", type: "map", keys: {type: "string", optional: false}, values: {type: "string", optional: false}, optional: false },
            { field: "AVG_NOISE_FLOOR_DBM", type: "double", optional: true},
            { field: "NOISE_FLOOR_DBM0", type: "double", optional: true},
            { field: "NOISE_FLOOR_DBM1", type: "double", optional: true},
            { field: "NOISE_FLOOR_DBM2", type: "double", optional: true},
            { field: "OFDM_ANI_LEVEL", type: "double", optional: true},
            { field: "OFDM_ANI_LEVEL_ADJUSTED", type: "double", optional: true}]},
    payload: {
        tags:  .TAGS ,
        AVG_NOISE_FLOOR_DBM: .AVG_NOISE_FLOOR_DBM,
        NOISE_FLOOR_DBM0: .NOISE_FLOOR_DBM0,
        NOISE_FLOOR_DBM1: .NOISE_FLOOR_DBM1,
        NOISE_FLOOR_DBM2: .NOISE_FLOOR_DBM2,
        OFDM_ANI_LEVEL: .OFDM_ANI_LEVEL,
        OFDM_ANI_LEVEL_ADJUSTED: .OFDM_ANI_LEVEL_ADJUSTED
        }
}'"'"' | \
kafkacat -b kafka-1:39092,kafka-2:49092,kafka-3:59092 -t sonos_metrics_01_json_with_schema -P -T'
So this:
{
  "TAGS": {
    "DEVICE": "Kitchen"
  },
  "AVG_NOISE_FLOOR_DBM": 104.33333333333333,
  "NOISE_FLOOR_DBM0": -104,
  "NOISE_FLOOR_DBM1": -109,
  "NOISE_FLOOR_DBM2": -100,
  "OFDM_ANI_LEVEL": 5,
  "OFDM_ANI_LEVEL_ADJUSTED": 3
}
Becomes this:
{
    "schema": { "type": "struct", "optional": false, "version": 1, "fields": [
        {"field": "tags", "type": "map", "keys": { "type": "string", "optional": false }, "values": { "type": "string", "optional": false }, "optional": false },
        {"field": "AVG_NOISE_FLOOR_DBM", "type": "double", "optional": true },
        { "field": "NOISE_FLOOR_DBM0", "type": "double", "optional": true },
        { "field": "NOISE_FLOOR_DBM1", "type": "double", "optional": true },
        { "field": "NOISE_FLOOR_DBM2", "type": "double", "optional": true },
        { "field": "OFDM_ANI_LEVEL", "type": "double", "optional": true },
        { "field": "OFDM_ANI_LEVEL_ADJUSTED", "type": "double", "optional": true }
        ]
    },
    "payload": {
        "tags": { "device": "Dining Room" },
        "AVG_NOISE_FLOOR_DBM": -0,
        "NOISE_FLOOR_DBM0": 0,
        "NOISE_FLOOR_DBM1": 0,
        "NOISE_FLOOR_DBM2": 0,
        "OFDM_ANI_LEVEL": null,
        "OFDM_ANI_LEVEL_ADJUSTED": null
    }
}
Whilst kafkacat is pretty neat for this kind of message manipulation, note that it will not preserve the partition, timestamp, or header of the source message.
Stream data from Kafka into InfluxDB 🔗
Back in ksqlDB we can now create a connector:
CREATE SINK CONNECTOR SINK_INFLUX_01 WITH (
        'connector.class'               = 'io.confluent.influxdb.InfluxDBSinkConnector',
        'value.converter'               = 'org.apache.kafka.connect.json.JsonConverter',
        'value.converter.schemas.enable'= 'true',
        'topics'                        = 'sonos_metrics_01_json_with_schema',
        'influxdb.url'                  = 'http://influxdb:8086',
        'influxdb.db'                   = 'sonos',
        'measurement.name.format'       = 'metrics'
  );
Check the connector status:
ksql> SHOW CONNECTORS;

 Connector Name | Type | Class                                       | Status
---------------------------------------------------------------------------------------------------
 SINK_INFLUX_01 | SINK | io.confluent.influxdb.InfluxDBSinkConnector | RUNNING (1/1 tasks RUNNING)
---------------------------------------------------------------------------------------------------
And in InfluxDB itself we can see data:
docker exec -it influxdb influx -execute 'SHOW MEASUREMENTS' -database 'sonos'
name: measurements
name
----
metrics
----

docker exec -it influxdb influx -database 'sonos' -execute 'SELECT LAST("AVG_NOISE_FLOOR_DBM") FROM "metrics" GROUP BY "device" LIMIT 3;'
name: metrics
tags: device=Bedroom
time                last
----                ----
1579608296503000000 103.66666666666667

name: metrics
tags: device=Dining Room
time                last
----                ----
1579608234480000000 0

name: metrics
tags: device=Kitchen
time                last
----                ----
1579608296491000000 104.33333333333333
Visualisation 🔗
Grafana is the tool I’m more familiar with, and plays nicely with InfluxDB.

I’ve taken the thresholds that the Sonos network matrix javascript code (quoted above) uses to determine good/warning/bad and overlaid these on the charts and used them to background colour the current values.
You can try the Grafana dashboard here.
It’s worth noting that in recent years Influx have developed their own visualisation tool, Chronograf, which is pretty nice too

Aggregation in ksqlDB 🔗
Because ksqlDB gives you a SQL interface to the data in Apache Kafka you can do things like:
-
Apply threshold calculations to the data as it passes through:
CREATE STREAM DEVICE_STATUS AS SELECT TIMESTAMPTOSTRING(ROWTIME,'yyyy-MM-dd HH:mm:ss','Europe/London') AS TS, TAGS['DEVICE'] AS DEVICE, AVG_NOISE_FLOOR_DBM, OFDM_ANI_LEVEL_ADJUSTED, CASE WHEN AVG_NOISE_FLOOR_DBM > 94 AND OFDM_ANI_LEVEL_ADJUSTED > 4 THEN 'GREEN' WHEN AVG_NOISE_FLOOR_DBM > 89 AND OFDM_ANI_LEVEL_ADJUSTED > 3 THEN 'YELLOW' WHEN AVG_NOISE_FLOOR_DBM > 84 AND OFDM_ANI_LEVEL_ADJUSTED > 2 THEN 'ORANGE' WHEN OFDM_ANI_LEVEL_ADJUSTED IS NULL THEN NULL ELSE 'RED' END AS STATUS FROM SONOS_HEALTH_METRICS EMIT CHANGES;ksql> SELECT TS, DEVICE, AVG_NOISE_FLOOR_DBM, OFDM_ANI_LEVEL_ADJUSTED, STATUS FROM DEVICE_STATUS WHERE STATUS IS NOT NULL EMIT CHANGES LIMIT 5; +--------------------+----------+---------------------+------------------------+-------+ |TS |DEVICE |AVG_NOISE_FLOOR_DBM |OFDM_ANI_LEVEL_ADJUSTED |STATUS | +--------------------+----------+---------------------+------------------------+-------+ |2020-01-14 06:23:04 |Bedroom |103.66666666666667 |3 |ORANGE | |2020-01-14 11:05:12 |Bedroom |103.66666666666667 |3 |ORANGE | |2020-01-14 11:10:21 |Bedroom |103.66666666666667 |3 |ORANGE | |2020-01-14 06:24:06 |Bedroom |103.0 |3 |ORANGE | |2020-01-14 11:14:29 |Bedroom |103.66666666666667 |2 |RED | Limit Reached Query terminated -
Show aggregate values based on the data in the Kafka topic:
ksql> SELECT TIMESTAMPTOSTRING(WINDOWSTART(),'yyyy-MM-dd HH:mm:ss','Europe/London') AS WINDOW_START_TS,
             DEVICE,
             STATUS,
             COUNT(*) AS STATUS_COUNT
        FROM DEVICE_STATUS
                WINDOW TUMBLING (SIZE 1 DAY)
        WHERE DEVICE='Kitchen'
          AND ROWTIME > (UNIX_TIMESTAMP() - 86400000)
        GROUP BY DEVICE, STATUS
        EMIT CHANGES;

+---------------------+---------+----------+---------------+
|WINDOW_START_TS      |DEVICE   |STATUS    |STATUS_COUNT   |
+---------------------+---------+----------+---------------+
|2020-01-21 00:00:00  |Kitchen  |YELLOW    |183            |
|2020-01-21 00:00:00  |Kitchen  |RED       |162            |
|2020-01-21 00:00:00  |Kitchen  |ORANGE    |156            |
|2020-01-21 00:00:00  |Kitchen  |GREEN     |5              |
[…]
Try it out! 🔗
Grab the Docker Compose from here, and give it a whirl.
-
You need to find the IP of your Sonos device (e.g. from the Sonos mobile app
About My System), and put this in thelog-sonos-to-kafka.shfile and then execute it:./log-sonos-to-kafka.sh -
Launch ksqlDB CLI:
docker exec -it ksqldb-cli bash -c 'echo -e "\n\n⏳ Waiting for ksqlDB to be available before launching CLI\n"; while : ; do curl_status=$(curl -s -o /dev/null -w %{http_code} http://ksqldb-server:8088/info) ; echo -e $(date) " ksqlDB server listener HTTP state: " $curl_status " (waiting for 200)" ; if [ $curl_status -eq 200 ] ; then break ; fi ; sleep 5 ; done ; ksql http://ksqldb-server:8088'
Then run through the article as shown, and enjoy!
You’ll find Grafana at http://localhost:3000 (login admin/admin) and Chronograf at http://localhost:8888/.
Appendix : TODO 🔗
-
The data at
http://<sonos player IP>:1400/support/reviewalso includes other things that would be interesting to extract and plot:-
the signal strength between each device
-
the
ifconfigstats for each device (packets received/dropped/errors etc)
-
Appendix : Other interesting Sonos web endpoints 🔗
-
/status/zp -
/status/proc/ath_rincon/status -
/status/ifconfig -
/status/showstp -
/tools.htm
So…did you fix your Sonos problems? 🔗
So I started this article with a teaser about a problem with my Sonos equipment, and how I wanted to try and troubleshoot it. What did I learn (other than plain-text is a crappy way to share metrics and is a PITA to parse)?
Well, whilst doing all this data stuff, I also moved all but one of my Sonos devices to "SonosNet", and away from wired connections. I’m using Powerline connectors in my house for hard wiring, and it’s not always great. Turns out the Sonos devices on their own wifi network work much better. So now I have a single Sonos device that’s wired into my router, and the rest just use a wifi link between themselves (separate from my home wifi network). This seems to have fixed the problem that I had with "burbling" and cutouts.
Footnote 🔗
Turns out the timing of this blog wasn’t so great:
Thread! I just got a letter from @Sonos about one of my old speakers. At face value it seems innocuous, but read between the lines and it's actually fairly threatening. pic.twitter.com/b0DZCrBuwW
— Sean Bonner Ⓥ (@seanbonner) January 21, 2020
